
Share Of Mortgages In Forbearance Decreases To 0.29% In October
[tta_listen_btn]
The Mortgage Bankers Association’s (MBA) monthly Loan Monitoring Survey revealed that the total number of loans now in forbearance decreased by 2 basis points from 0.31% of servicers’ portfolio volume in the prior month to 0.29% as of October 31, 2023. According to MBA’s estimate, 145,000 homeowners are in forbearance plans. Mortgage servicers have provided forbearance to approximately 8 million borrowers since March 2020.
In October 2023, the share of Fannie Mae and Freddie Mac loans in forbearance remained flat at 0.18%. Ginnie Mae loans in forbearance decreased 5 basis points to 0.52%, and the forbearance share for portfolio loans and private-label securities (PLS) decreased 3 basis points to 0.32%.
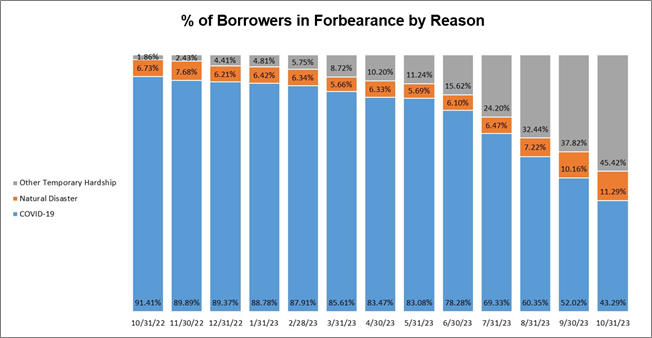
“For the first time since MBA began tracking the reasons for forbearance in October 2022, temporary hardships such as job loss, death, and divorce represent a larger share of loans in forbearance by reason than a COVID-19 hardship,” said Marina Walsh, CMB, MBA’s Vice President of Industry Analysis. “This upward trend will continue, as Fannie Mae and Freddie Mac sunset the use of COVID-19 as a reason for delinquency starting in November 2023,[1] and FHA’s COVID-19 forbearance period ends at the end of November 2023[2].”
Added Walsh, “Forbearance is still an option for many distressed homeowners, but in most cases, the requirements to obtain a forbearance will not be as streamlined as they were during the pandemic.”
Key Findings of MBA’s Loan Monitoring Survey – October 1 to October 31, 2023
- Total loans in forbearance decreased by 2 basis points in October 2023 relative to September 2023: from 0.31% to 0.29%.
- By investor type, the share of Ginnie Mae loans in forbearance decreased relative to the prior month: from 0.57% to 0.52%.
- The share of Fannie Mae and Freddie Mac loans in forbearance remained the same relative to the prior month at 0.18%.
- The share of other loans (e.g., portfolio and PLS loans) in forbearance decreased relative to the prior month: from 0.35% to 0.32%.
- Loans in forbearance as a share of servicing portfolio volume (#) as of October 31, 2023:
- Total: 0.29% (previous month: 0.31%)
- Independent Mortgage Banks (IMBs): 0.36% (previous month: 0.37%)
- Depositories: 0.23% (previous month: 0.25%)
- By reason, 45.4% of borrowers are in forbearance for reasons such as a temporary hardship caused by job loss, death, divorce, or disability; while 43.3% of borrowers are in forbearance because of COVID-19. Another 11.3% are in forbearance because of a natural disaster.
- By stage, 45.1% of total loans in forbearance are in the initial forbearance plan stage, while 47.0% are in a forbearance extension. The remaining 7.9% are forbearance re-entries, including re-entries with extensions.
- Of the cumulative forbearance exits for the period from July 1, 2020, through October 31, 2023, at the time of forbearance exit:
- 29.4% resulted in a loan deferral/partial claim.
- 17.7% represented borrowers who continued to make their monthly payments during their forbearance period.
- 18.3% represented borrowers who did not make all of their monthly payments and exited forbearance without a loss mitigation plan in place yet.
- 16.1% resulted in a loan modification or trial loan modification.
- 10.8% resulted in reinstatements, in which past-due amounts are paid back when exiting forbearance.
- 6.5% resulted in loans paid off through either a refinance or by selling the home.
- The remaining 1.2% resulted in repayment plans, short sales, deed-in-lieus or other reasons.
- Total loans serviced that were current (not delinquent or in foreclosure) as a percent of servicing portfolio volume (#) decreased to 95.80% (on a non-seasonally adjusted basis) in October 2023 from 95.83% in September 2023.
- The five states with the highest share of loans that were current as a percent of servicing portfolio: Washington, Colorado, Idaho, Oregon, and California.
- The five states with the lowest share of loans that were current as a percent of servicing portfolio: Louisiana, Mississippi, Indiana, West Virginia, and New York.
- Total completed loan workouts from 2020 and onward (repayment plans, loan deferrals/partial claims, loan modifications) that were current as a percent of total completed workouts increased to 72.30% in October from 72.20% the previous month.
The Place for Lending Visionaries and Thought Leaders. We take you beyond the latest news and trends to help you grow your lending business.