
Credit Availability Increased In October
Mortgage credit availability increased in October according to the Mortgage Credit Availability Index (MCAI), a report from the Mortgage Bankers Association (MBA) that analyzes data from Ellie Mae’s AllRegs Market Clarity business information tool.
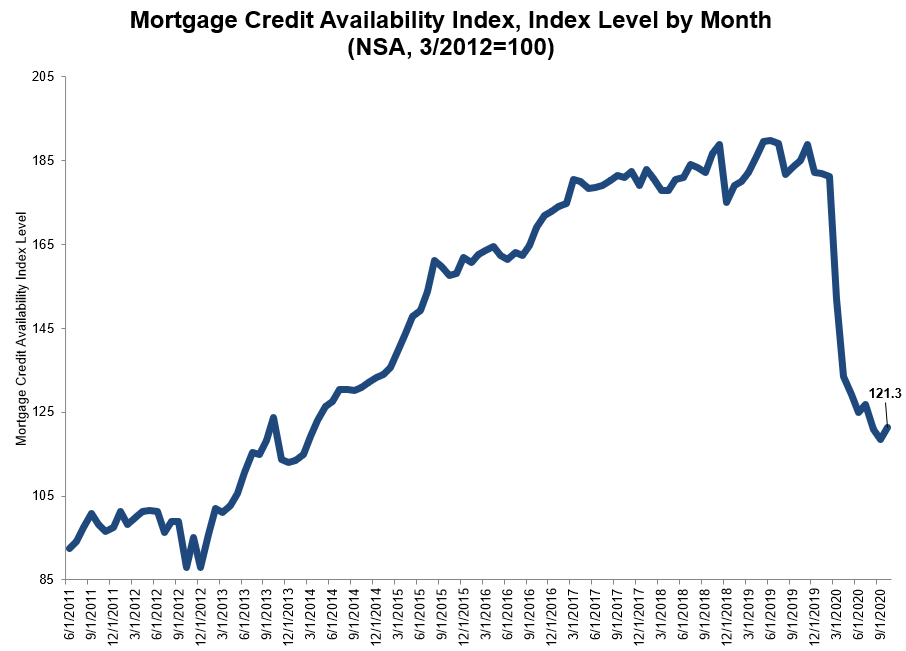
The MCAI rose by 2.3 percent to 121.3 in October. A decline in the MCAI indicates that lending standards are tightening, while increases in the index are indicative of loosening credit. The index was benchmarked to 100 in March 2012. The Conventional MCAI increased 5.1 percent, while the Government MCAI increased by 0.2 percent. Of the component indices of the Conventional MCAI, the Jumbo MCAI increased by 6.1 percent, and the Conforming MCAI rose by 4.1 percent.
“Credit availability increased in October for the first time since July. The ongoing economic recovery and improving labor market led to a rise in credit supply for various loan types,” said Joel Kan, MBA’s Associate Vice President of Economic and Industry Forecasting. “There was an overall increase in credit availability for low credit score and higher LTV loans, with conventional credit supply increasing 5.1 percent, and government credit staying essentially flat. Despite October’s slight turnaround, credit availability remains constrained to near a low last seen in 2014.”
Added Kan, “After seeing a drop in supply of around 60 percent since the onset of the pandemic, the jumbo index rebounded 6.1 percent in October to its highest level since July of this year. There was also an increase in ARM loan supply, likely driven by the GSEs’ September 30 deadline for LIBOR ARM loan applications. More lenders rolled out SOFR ARMs following the deadline.”
Source: Mortgage Bankers Association; Powered by Ellie Mae’s AllRegs® Market Clarity®
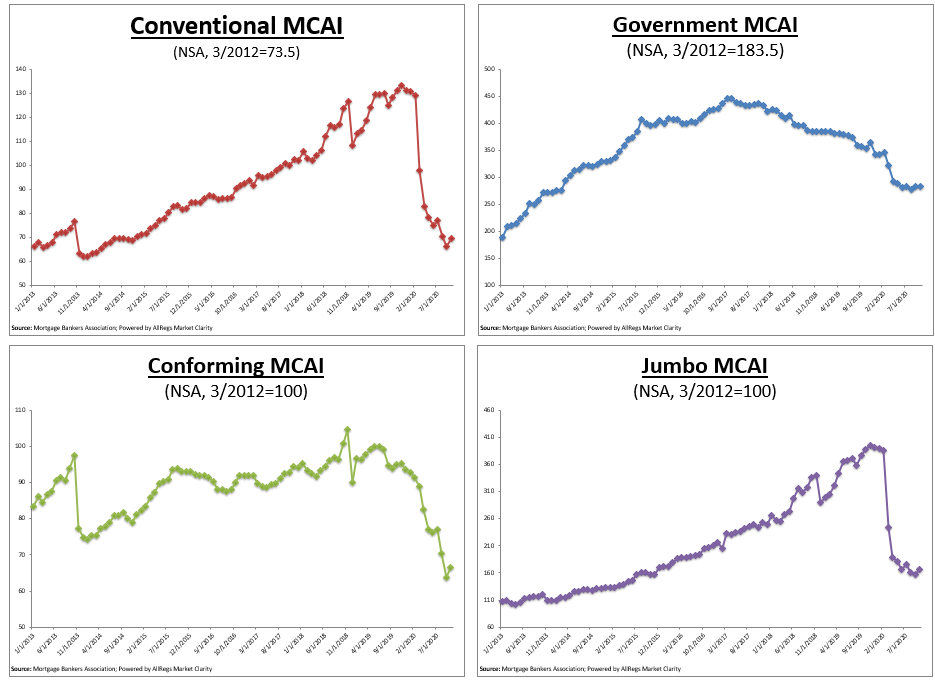
CONVENTIONAL, GOVERNMENT, CONFORMING, AND JUMBO MCAI COMPONENT INDICES
The MCAI rose by 2.3 percent to 121.3 in October. The Conventional MCAI increased 5.1 percent, while the Government MCAI increased by 0.2 percent. Of the component indices of the Conventional MCAI, the Jumbo MCAI increased by 6.1 percent, and the Conforming MCAI rose by 4.1 percent.
Source: Mortgage Bankers Association; Powered by Ellie Mae’s AllRegs® Market Clarity®
The Conventional, Government, Conforming, and Jumbo MCAIs are constructed using the same methodology as the Total MCAI and are designed to show relative credit risk/availability for their respective index. The primary difference between the total MCAI and the Component Indices are the population of loan programs which they examine. The Government MCAI examines FHA/VA/USDA loan programs, while the Conventional MCAI examines non-government loan programs. The Jumbo and Conforming MCAIs are a subset of the conventional MCAI and do not include FHA, VA, or USDA loan offerings. The Jumbo MCAI examines conventional programs outside conforming loan limits, while the Conforming MCAI examines conventional loan programs that fall under conforming loan limits.
The Conforming and Jumbo indices have the same “base levels” as the Total MCAI (March 2012=100), while the Conventional and Government indices have adjusted “base levels” in March 2012. MBA calibrated the Conventional and Government indices to better represent where each index might fall in March 2012 (the “base period”) relative to the Total=100 benchmark.
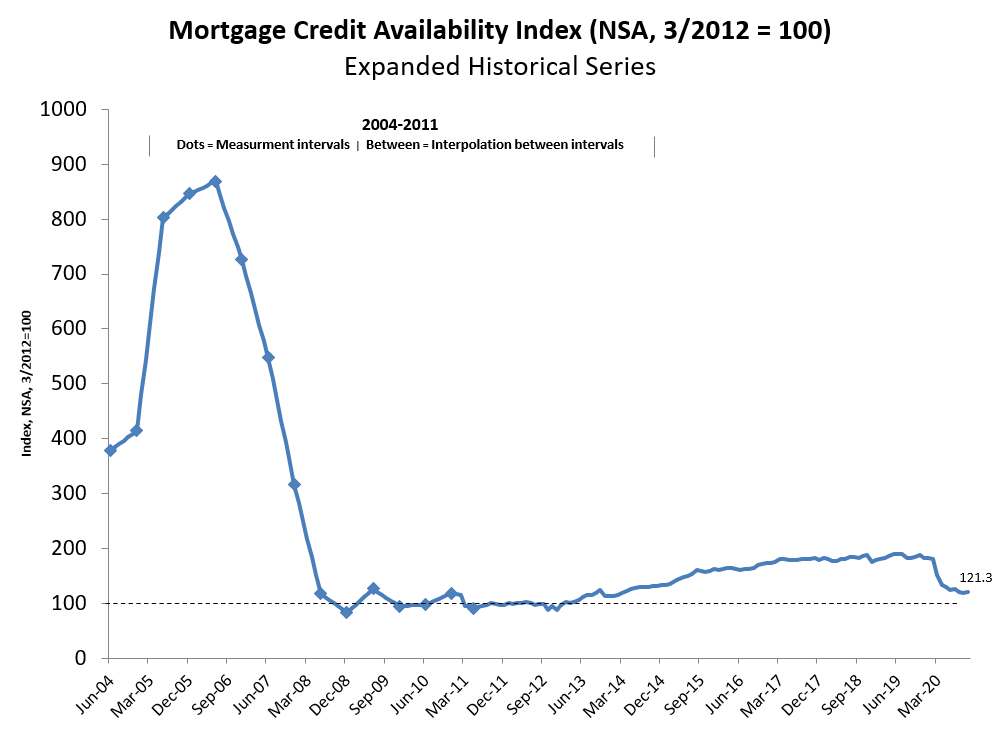
EXPANDED HISTORICAL SERIES
The Total MCAI has an expanded historical series that gives perspective on credit availability going back approximately 10-years (expanded historical series does not include Conventional, Government, Conforming, or Jumbo MCAI). The expanded historical series covers 2004 through 2010, and was created to provide historical context to the current series by showing how credit availability has changed over the last 10 years – including the housing crisis and ensuing recession. Data prior to March 31, 2011, was generated using less frequent and less complete data measured at 6-month intervals and interpolated in the months between for charting purposes. Methodology on the expanded historical series from 2004 to 2010 has not been updated.
Source: Mortgage Bankers Association; Powered by Ellie Mae’s AllRegs® Market Clarity®
Data prior to 3/31/2011 was generated using less frequent and less complete data measured at 6-month intervals interpolated in the months between for charting purposes.
The Place for Lending Visionaries and Thought Leaders. We take you beyond the latest news and trends to help you grow your lending business.