
Data: S&P CoreLogic Case-Shiller Index Accelerates In October
[tta_listen_btn]
S&P Dow Jones Indices (S&P DJI) released the latest results for the S&P CoreLogic Case-Shiller Indices, the leading measure of U.S. home prices. Data released for October 2023 show that 11of the 20 major metro markets reported month-over-month price increases.
YEAR-OVER-YEAR
The S&P CoreLogic Case-Shiller U.S. National Home Price NSA Index, covering all nine U.S. census divisions, reported a 4.8% annual change in October, up from a 4% change in the previous month. The 10-City Composite showed an increase of 5.7%, up from a 4.8% increase in the previous month. The 20-City Composite posted a year-over-year increase of 4.9%, up from a 3.9% increase in the previous month. Detroit reported the highest year-over-year gain among the 20 cities with an 8.1% increase in October, followed again by San Diego with a 7.2% increase. Portland fell 0.6% and remained the only city reporting lower prices in October versus a year ago.
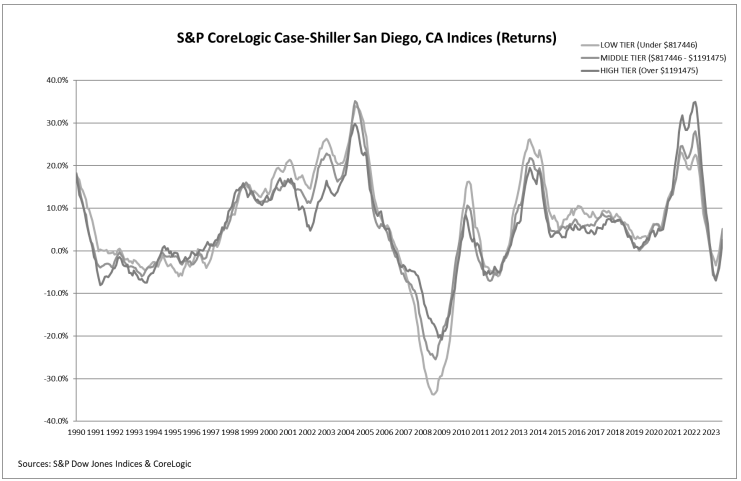
The chart compares year-over-year returns of different housing price ranges (tiers) for San Diego.
MONTH-OVER-MONTH
Before seasonal adjustment, the U.S. National Index and10-City Composite, posted 0.2% month-over-month increases in October, while the 20-City composite posted 0.1% increase.
After seasonal adjustment, the U.S. National Index, the 10-City and 20-City Composites each posted month-over-month increases of 0.6%.
ANALYSIS
“U.S. home prices accelerated at their fastest annual rate of the year in October”, says Brian D. Luke, Head of Commodities, Real & Digital assets at S&P DJI. Our National Composite rose by 0.2% in October, marking nine consecutive monthly gains and the strongest national growth rate since 2022.”
“Detroit kept pace as the fastest growing market for the second month in a row, registering an 8.1% annual gain. San Diego maintained the second spot with 7.2% annual gains, following by New York with a 7.1% gain. We are experiencing broad based home price appreciation across the country, with steady gains seen in nineteen of twenty cities. This month’s report reflects trendline growth compared to historical returns and little disparity among cities and regions.”
“Each of our 10-city, 20-city and National Index, remain at all-time highs, with 8 of 20 cities registering all-time highs (Miami, Atlanta, Chicago, Boston, Detroit, Charlotte, New York and Cleveland). While Portland remains slightly down compared to last year’s gains, Phoenix and Las Vegas have flipped to year over year gains. The Midwest and the Northeast region are fastest growing markets, while the Southwest and West regions have lagged other regions for over a year. A solid, if unspectacular report, this month’s index reflects a rising tide across nearly all markets.”
“Home prices leaned into the highest mortgage rates recorded in this market cycle and continued to push higher. With mortgage rates easing and the Federal Reserve guiding toward a slightly more accommodative stance, homeowners may be poised to see more appreciation.”
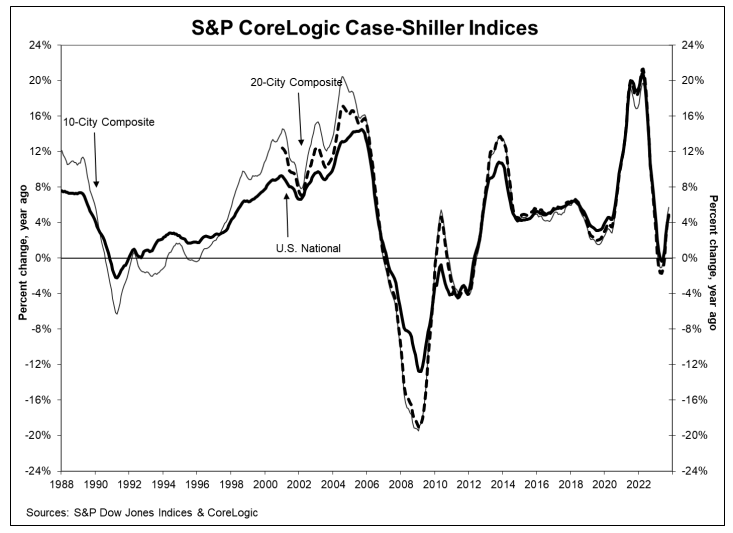
SUPPORTING DATA
The chart below depicts the annual returns of the U.S. National, 10-City Composite, and 20-City Composite Home Price Indices. The S&P CoreLogic Case-Shiller U.S. National Home Price NSA Index, which covers all nine U.S. census divisions, recorded a 4.8% annual increase in October 2023. The 10-City and 20-City Composites reported year-over-year increase of 5.7% and 4.9%, respectively.
The Place for Lending Visionaries and Thought Leaders. We take you beyond the latest news and trends to help you grow your lending business.