
For Lenders, Data Visualization Holds The Key To Maximizing The Value of Real-Time Data
As mortgage technology continues to evolve toward browser-based, modern systems, lenders have gained access to increasingly more data – much of it in real-time. This is proving important in dynamic housing markets like we see today as it enables lenders to gain faster insight into where market opportunities are emerging (or where they may already exist) so that they can adjust their business strategy accordingly.
Lenders have, for a while now, embraced the use of real-time data in the loan application and origination process. Notably, through verification of income and employment when evaluating borrowers or real-time updates to appraisal, flood and title services, time-to-close has been streamlined significantly. Lenders are increasingly making use of real-time, loan-level data within operations to monitor production more accurately within their branch networks.
Having systems in place with real-time data capabilities is just the first step, however. The challenge that many lenders are struggling with now is one of “data overload.” Like the proverbial example of “drinking from a firehose,” the sheer amount of data available is making it difficult for staff to parse, evaluate and execute when faced with continuously updating, real-time data sets.
This is where data visualization plays a key role.
At its core, data visualization is simply the graphical representation of information and data into a more easily comprehended, usable format. The concept of data visualization is nothing new – just think of the dashboard display in any vehicle you’ve driven or ridden in during your lifetime – yet its application as a component of automation is not as ubiquitous as one might expect.
Too often, branch managers and their supervisors at the corporate level are extracting volumes of data from a real-time environment and then importing it into a static, spreadsheet-based environment for further (usually manual) analysis. This is problematic for several reasons as it introduces the opportunity for human error, slows down the lender’s ability to react to market dynamics, and most notably, negates the very value of having real-time data to work from in the first place.
A better approach includes providing intuitive drilldowns from the graphs to the loans that make up the graph. From there, managers can drilldown into the details about each loan. Properly configured systems control what managers are allowed to see in the drilldown – all the way to limiting the loan detail per loan.
More so than perhaps any other industry, mortgage lending and loan accounting features a large total number of individual transactions within each loan. Branch managers and should be focusing their attention on bringing new loans into the pipeline, not grinding through an origination report in a multi-page spreadsheet format. Branch managers need to be able to quickly see how their business is doing at any given time. When additional detail is required, branch managers should be able to drill down to the loans that make up the total, including the individual loan P&Ls, either in dollars or BPS, tailored by the system to their perspective.
Consider the graphic below, where a manager can readily gain up-to-date loan production detail in terms of loan volumes, loan type (conventional, refinance, jumbo, VA, FHA, etc.).
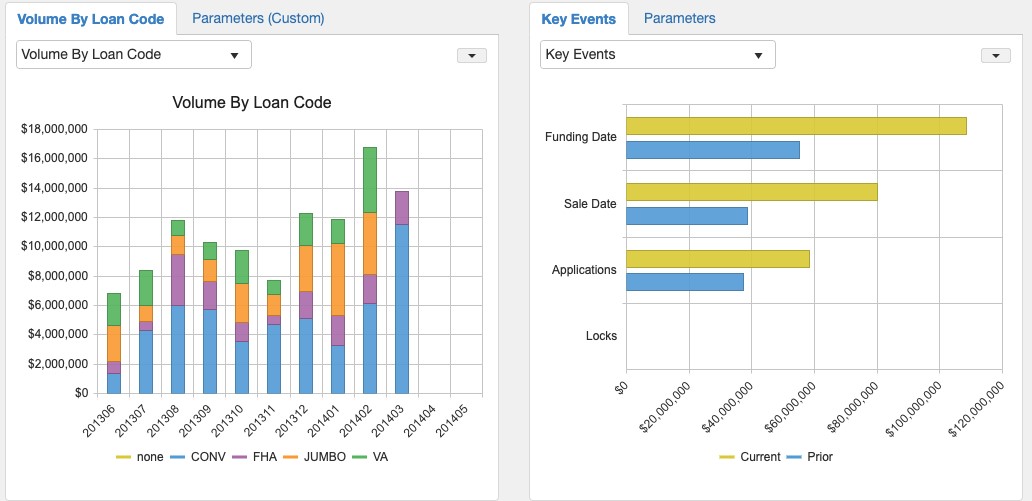
Beyond being a more efficient, more accurate evaluation and management of the loan pipeline, this supports improved management of compensation for branch managers and loan officers. In a competitive labor market where established, proven producers are the key to success, analysis like this provides a value-add for lenders to retain their best talent (and add new talent).
For corporate accounting executives, visualized data on average days to fund by branch (as seen below) provides more accurate intelligence into individual branch performance and its relevance within the health of the overall branch network.
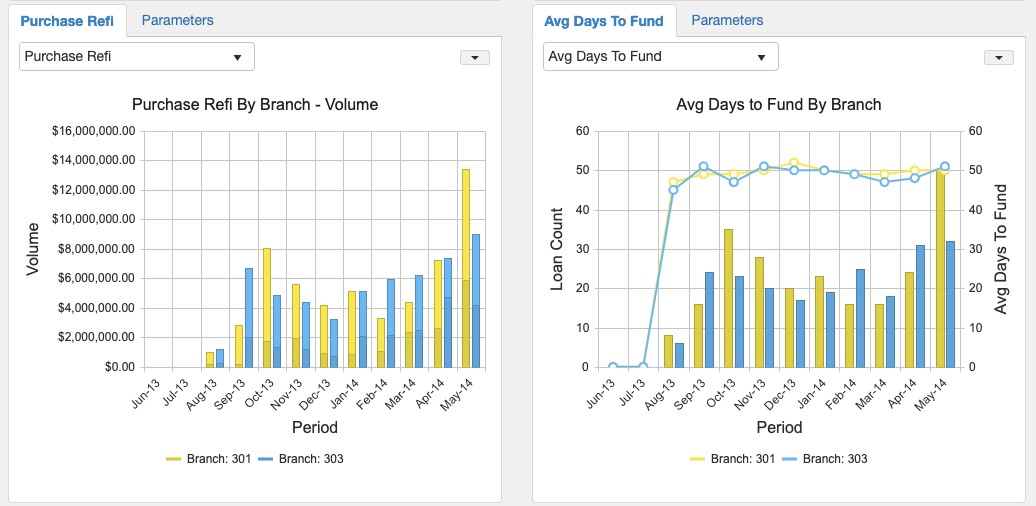
This ability to view financial results more graphically and systematically helps them gain a more accurate view into the current level of loan activity and the lender’s bottom line. With the resurgence of dedicated branch managers in local markets and the emphasis on purchase business, quick access to this type of information is vitally important.
As mortgage lending automation continues to evolve, it stands to reason that the sheer amount of useful data and analytics available to lenders will only continue to increase, quickly outpacing (if it hasn’t already) their staff’s ability to process it and use it in a meaningful way. Data visualization provides a much-needed tool – for those who choose to use it – to maximize this wealth of information and drive positive business outcomes.

Joe Ludlow is the Vice President for Irvine, Calif-based Advantage Systems, a provider of accounting and financial management tools for the mortgage industry. Ludlow can be reached at [email protected], and more information on the company can be found at www.mortgageaccounting.com.