
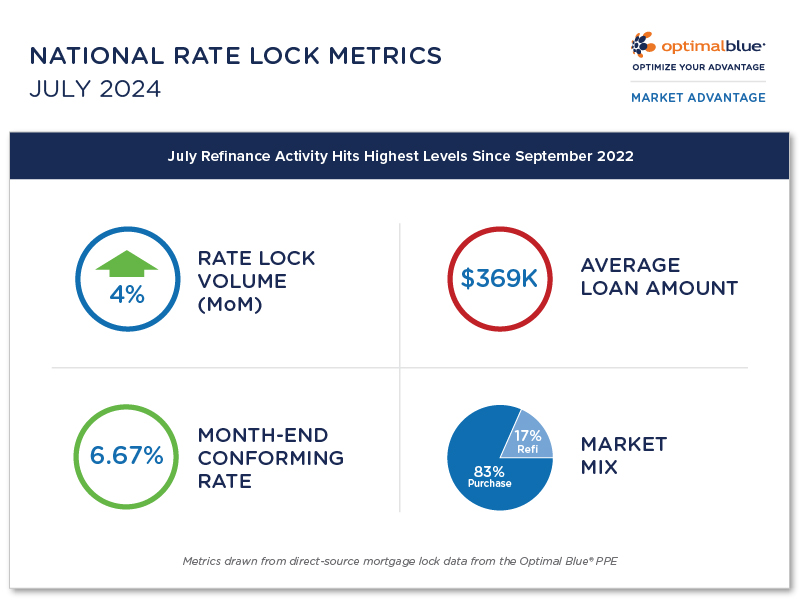
July Refinance Activity Hits Highest Levels Since September 2022
Optimal Blue released its July 2024 Market Advantage mortgage data report, which revealed that mortgage refinance demand surged to levels not seen since September 2022 amid softening interest rates. The lower interest rates seen in July also coaxed increased purchase activity, which, combined with greater refi activity, drove a 3.5% month-over-month (MoM) increase in mortgage rate lock volumes.
“The July report shows a notable uptick in refinance activity, particularly rate-and-term refinances, which jumped 12% as borrowers responded to declining interest rates,” said Brennan O’Connell, director of data solutions at Optimal Blue. “The drop in the Optimal Blue Mortgage Market Indices 30-year conforming rate to 6.67% played a significant role in this growth, and we observed the highest level of refinance activity since September 2022.”
Key findings from the Market Advantage report, which are drawn from direct-source mortgage lock data, are:
- Increase in rate lock volume: Overall rate lock volume rose by 3.5% MoM, with purchase activity up 2.5% and refinance activity showing even stronger growth. Cash-out refinance volume grew by 5.9% MoM, while rate-and-term refinance activity surged 12.3%, reflecting borrower sensitivity to lower rates.
- Purchase lock count growth: Purchase lock counts grew by 2.5% MoM in July, though they remained down 7% year-over-year (YoY). This is a significant improvement over June’s 17% YoY decline, suggesting a potential stabilization in purchase demand as the market adjusts.
- Refinance activity surge: Refinance activity reached its highest level since September 2022, with the refinance share growing to 17% of total volume – an 81-basis-point increase from June and a 472-basis-point rise YoY. This aligns with trends in the OBMMI 30-year conforming rate, which ended July 2024 at 6.67%, nearly identical to the 6.68% rate that closed out September in 2022.
- Rate and treasury movements: The OBMMI 30-year conforming rate ended July at 6.67%, down 26 basis points from June. Meanwhile, the 10-year Treasury yield dropped by 27 basis points to 4.09%. The spread between the 30-year conforming rate and the 10-year Treasury remained stable at 258 basis points, an uptick of just 1 basis point.
- Shift in loan mix: The loan mix in July shifted toward agency production. Conforming loans increased market share to 56.1% (+18 bps), FHA loans grew to 19.0% (+61 bps), and VA loans rose to 11.9% (+22 bps). Conversely, non-conforming loans, including jumbo and non-QM, saw a decline in market share, falling to 12.4% (-107 bps).
- Decrease in average loan amount: The average loan amount decreased from $374K in June to $369K in July, reflecting the shift away from non-conforming loan types.
- Stable credit quality: Credit scores remained stable, with the average score holding steady at 732.
The Place for Lending Visionaries and Thought Leaders. We take you beyond the latest news and trends to help you grow your lending business.