US CoreLogic S&P Case-Shiller Index Switches Gears In July, Increases 1% Year Over Year
With July’s small pivot in annual home prices and given the early spring surges, the CoreLogic S&P Case-Shiller Index now shows a 6% cumulative increase in home prices for 2023. And while some metro areas, particularly those in the West, are recovering from larger declines seen in 2022, appreciation across the country has generally been solid. Lower-priced homes are seeing a stronger recovery, given the lack of affordable inventory and the resulting demand pressure on that segment of the housing market.
“After a strong, 5% cumulative U.S. home price gain since the early spring, monthly increases are plateauing to a seasonal average, which reflects the pressure that higher mortgage rates have put on affordability. As a result of the early 2023 growth, annual price appreciation should accelerate in the coming months before slowing again. Areas in the Midwest continue to lead the national gains given their relative affordability. Markets that saw home prices reset following the recent surge in mortgage rates are expected to see stronger gains over the next 12 months, particularly those in the West,” said Dr. Selma Hepp, CoreLogic chief economist.
- In July, the CoreLogic S&P Case-Shiller Index increased by 1% year over year after holding steady in June and declining in April and May. (Figure 1). Since the index’s trough in January, home prices are up by 6%.
- The 10-city and 20-city composite indexes also pivoted in July, posting their first increase in five months, up by 0.9% and 0.1% respectively. The 20-city index remains relatively weaker, as smaller metros are more sensitive to affordability challenges (Figure 1).
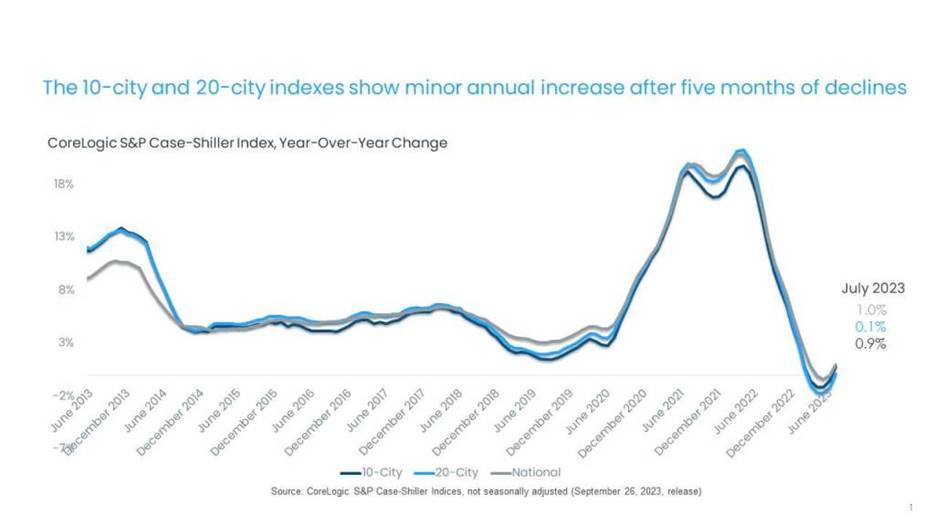
Figure 1: July home prices post annual growth for the first time since April
© 2023 CoreLogic,Inc., All rights reserved.
- The non-seasonally adjusted month-over-month index posted its sixth month of gains, up by 0.6% in July, a smaller increase than the one recorded in June at 0.9%, when price gains plateaued in response to higher mortgage rates. With a half-year of monthly gains, home prices are now up by 1% from the June 2022 peak. Between 2015 and 2019, July gains averaged 0.5% (Figure 2).
- Chicago led the 20-city index with an annual gain of 4.4%. Cleveland (up by 4%), New York (up by 3.8%) and Detroit (up by 3.2%) followed with similarly strong annual increases.
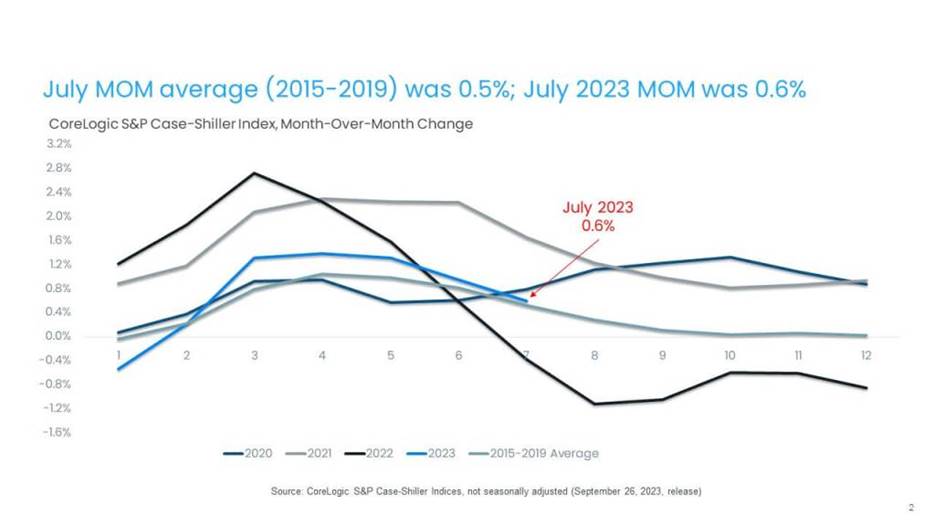
Figure 2: Month-over-month prices increases slightly exceed average in July
© 2023 CoreLogic,Inc., All rights reserved.
- In July, 18 metros saw annual home price gains reaccelerate from the month before, with the most notable improvement recorded in West Coast markets, particularly San Diego, San Francisco, Los Angeles and Seattle, where annual declines were about 3 percentage points less when compared with June (Figure 3).
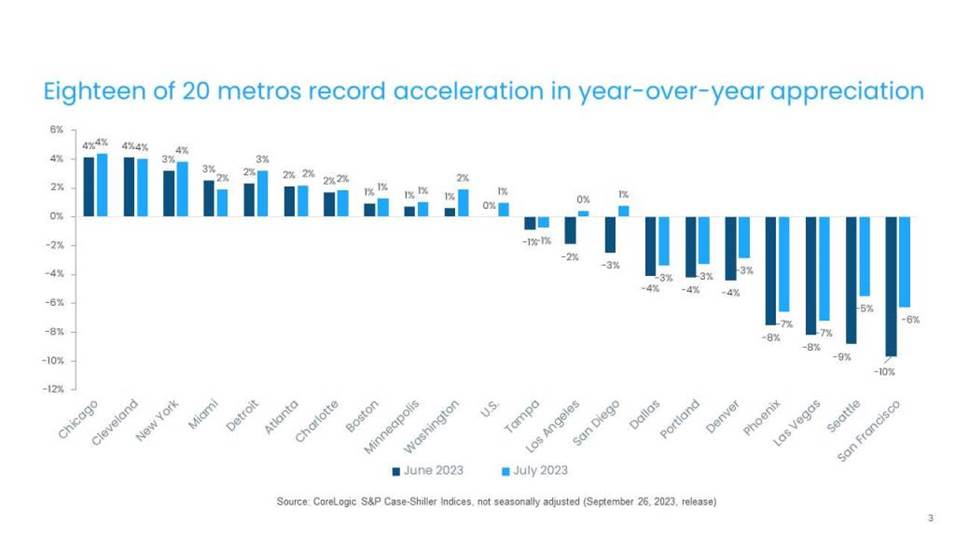
Figure 3: 20 metros post pivots in annual declines
© 2023 CoreLogic,Inc., All rights reserved.
- Las Vegas, Phoenix and New York posted the nation’s largest monthly gains, about 1% each, while Portland, Oregon declined by about 0.2% (Figure 4). And while home prices were generally up from June in most price tiers, Portland and San Francisco posted minor declines the in middle and high tiers.
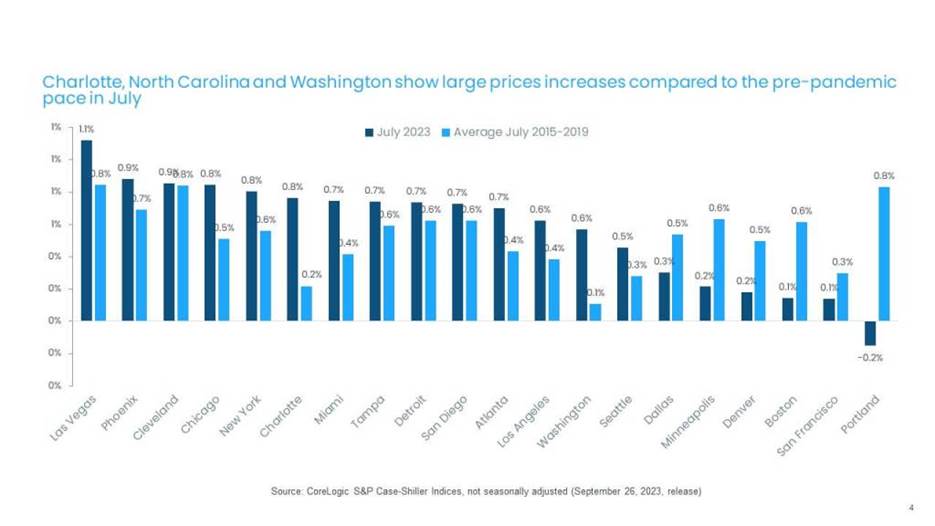
Figure 4: Monthly gains exceed pre-pandemic averages in many markets
© 2023 CoreLogic,Inc., All rights reserved.
- Across price tiers, the high tier continued to show relative weakness, down by 1.3% year over year, the six month of annual declines and similar to trends observed in CoreLogic’s Single-Family Rent Index. This may reflect the greater mobility of higher-income households during the pandemic, a trend that has since waned. In addition, the surge in demand for luxury and second homes seen in 2021 and 2022 has also contracted relatively more since the increase in mortgage rates and the stalling of home sales activity. The middle tier remained flat for the sixth straight month in July, while the low tier moved into positive territory again, up by 0.5%, after three months of annual declines. Figure 5 shows monthly price changes across select U.S. metros and the three tracked tiers.
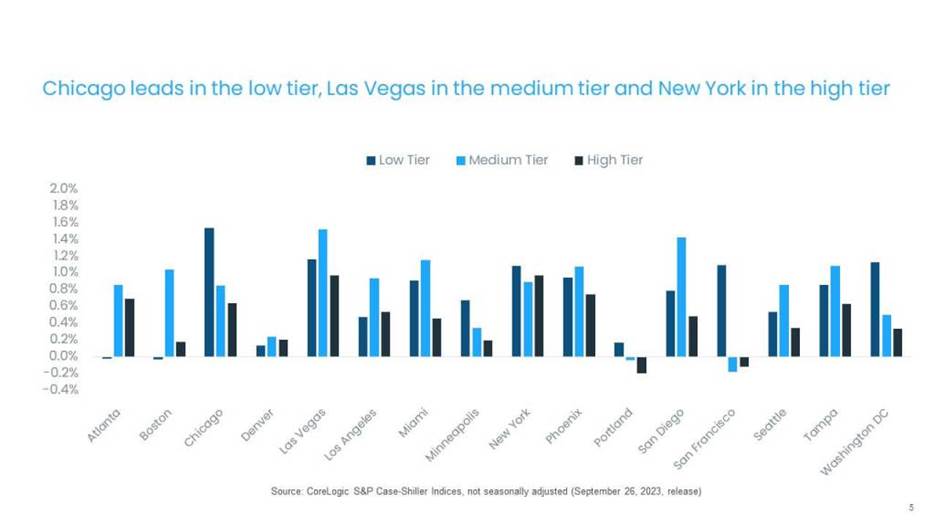
Figure 5: Monthly price increases average 0.7% for low tier, 0.8% for medium tier and 0.4% for high tier
© 2023 CoreLogic,Inc., All rights reserved.
- While high-tier home prices are generally weaker, some markets have recorded more strength in recent months, such as Chicago, up by 4% year over year, and New York, up by 3% annually.
- Low-tier gains, while positive in the national index, were particularly strong in New York, up by 7%, and Miami and Chicago, both up by 6%. Phoenix and Les Vegas continued to post largest annual declines across all price tiers.
- After a strong 6% cumulative U.S. home price gain since the early spring, monthly increases are plateauing to a seasonal average, which reflects the pressure that continued higher mortgage rates have put on affordability. Nevertheless, as a result of the spring gains, annual price appreciation should accelerate in the coming months before slowing again. Areas in the Midwest continue to lead the national gains given their relative affordability. On the other hand, markets that saw home prices reset following the surge in rates are now expected to see stronger gains over the next 12 months, particularly those in the West.
The Place for Lending Visionaries and Thought Leaders. We take you beyond the latest news and trends to help you grow your lending business.