Data: Share Of Mortgages In Forbearance Decreases To 0.64% In January
The Mortgage Bankers Association’s (MBA) monthly Loan Monitoring Survey revealed that the total number of loans now in forbearance decreased by 6 basis points from 0.70% of servicers’ portfolio volume in the prior month to 0.64% as of January 31, 2023. According to MBA’s estimate, 320,000 homeowners are in forbearance plans.
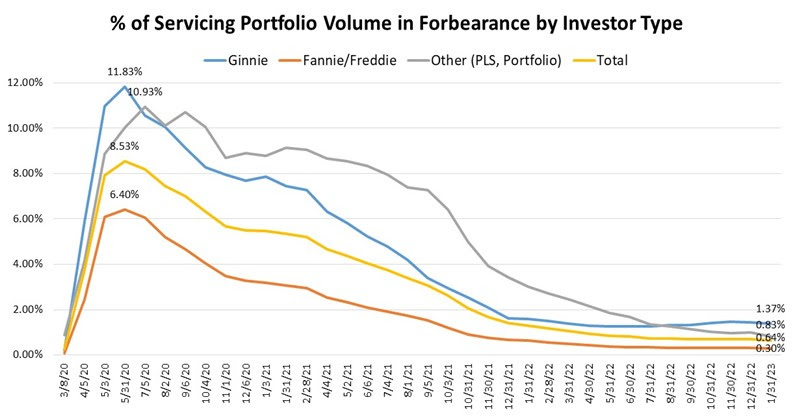
The share of Fannie Mae and Freddie Mac loans in forbearance decreased 1 basis point to 0.30%. Ginnie Mae loans in forbearance decreased 8 basis points to 1.37%, and the forbearance share for portfolio loans and private-label securities (PLS) decreased 17 basis points to 0.83%.
“The forbearance rate decreased across all investor types in January, as borrowers continued to recover from pandemic-related hardships,” said Marina Walsh, CMB, MBA’s Vice President of Industry Analysis. “With the national emergency set to end on May 11 of this year, many borrowers will no longer have the option to initiate COVID-19-related forbearance. Mortgage forbearance in other forms – whether due to natural disasters or life events – will continue, albeit with different requirements and parameters.”
Key Findings of MBA’s Loan Monitoring Survey – January 1 to January 31, 2023
- Total loans in forbearance decreased by 6 basis points in January 2023 relative to December 2022: from 0.70% to 0.64%.
- By investor type, the share of Ginnie Mae loans in forbearance decreased relative to the prior month: from 1.45% to 1.37%.
- The share of Fannie Mae and Freddie Mac loans in forbearance decreased relative to the prior month: from 0.31% to 0.30%.
- The share of other loans (e.g., portfolio and PLS loans) in forbearance decreased relative to the prior month: from 1.00% to 0.83%.
- Loans in forbearance as a share of servicing portfolio volume (#) as of January 31, 2023:
- Total: 0.64% (previous month: 0.70%)
- Independent Mortgage Banks (IMBs): 0.86% (previous month: 0.97%)
- Depositories: 0.42% (previous month: 0.44%)
- By stage, 36.9% of total loans in forbearance are in the initial forbearance plan stage, while 49.9% are in a forbearance extension. The remaining 13.2% are forbearance re-entries, including re-entries with extensions.
- Of the cumulative forbearance exits for the period from June 1, 2020, through January 31, 2023, at the time of forbearance exit:
- 29.6% resulted in a loan deferral/partial claim.
- 18.1% represented borrowers who continued to make their monthly payments during their forbearance period.
- 17.5% represented borrowers who did not make all of their monthly payments and exited forbearance without a loss mitigation plan in place yet.
- 16.1% resulted in a loan modification or trial loan modification.
- 10.9% resulted in reinstatements, in which past-due amounts are paid back when exiting forbearance.
- 6.6% resulted in loans paid off through either a refinance or by selling the home.
- The remaining 1.2% resulted in repayment plans, short sales, deed-in-lieus or other reasons.
- Total loans serviced that were current (not delinquent or in foreclosure) as a percent of servicing portfolio volume (#) increased to 95.86% in January 2023 from 95.69% in December 2023 (on a non-seasonally adjusted basis).
- The five states with the highest share of loans that were current as a percent of servicing portfolio: Washington, Idaho, Colorado, Utah, and California.
- The five states with the lowest share of loans that were current as a percent of servicing portfolio: Louisiana, Mississippi, Indiana, West Virginia, and New York.
- Total completed loan workouts from 2020 and onward (repayment plans, loan deferrals/partial claims, loan modifications) that were current as a percent of total completed workouts increased to 76.03% in January from 75.92% the previous month.
The Place for Lending Visionaries and Thought Leaders. We take you beyond the latest news and trends to help you grow your lending business.