Median Home Prices Reach A New Peek
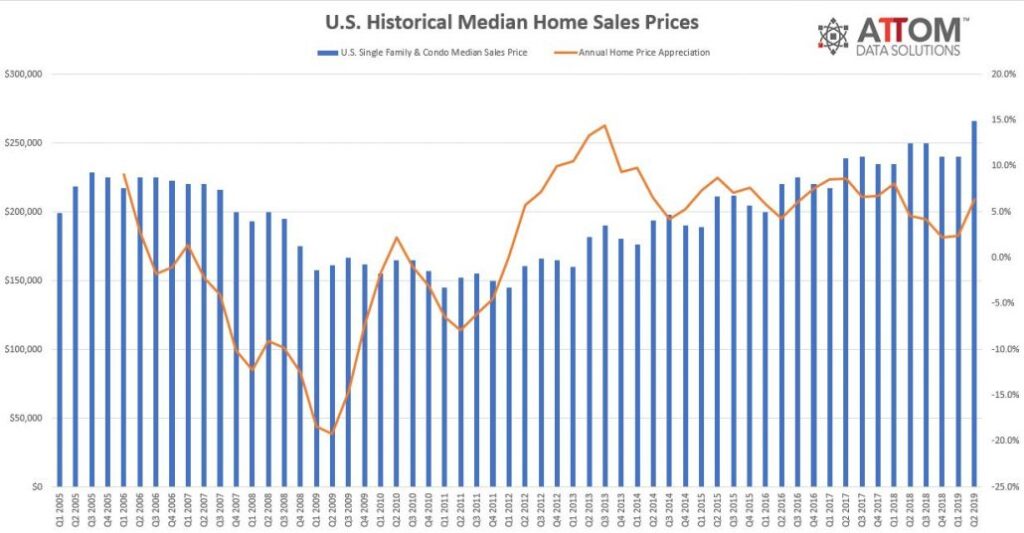
ATTOM Data Solutions released its Q2 2019 U.S. Home Sales Report, which shows that U.S. single family homes and condos sold for a median price of $266,000 in the second quarter, up 10.8 percent from the previous quarter and up 6.4 percent from a year ago — reaching a new median home price peak.
Meanwhile, the report also shows that homeowners who sold in the second quarter had owned an average of 8.09 years, reaching a new peak, up 3 percent from last quarter and up 4 percent from Q2 2018. Homeownership tenure averaged 4.21 years nationwide between Q1 2000 and Q3 2007, prior to the Great Recession.
“As warmer weather brings a rush of house hunters to the market, the latest spike in median home prices marked the largest quarterly increase since the second quarter of 2015 and the third biggest increase since the market started climbing out of the Great Recession in 2012,” said Todd Teta, chief product officer at ATTOM Data Solutions. “However, in looking at historical trends, the second quarter of every year has always shown a quarterly increase, going as far back as 2005. So, with mortgage rates dipping to new lows, it’s no surprise that people were wanting to buy a home, even if prices were at their peak. We expect to see milder home prices in the coming quarters.”
Annual home price appreciations rising in Milwaukee, Boston and Salt Lake City
Median home prices in 133 of the 149 metro areas analyzed in the report (89 percent) saw an annual home price appreciation in the second quarter of 2019, led by Atlantic City, New Jersey (16.0 percent increase); Boise City, Idaho (14.0 percent increase); Chattanooga, Tennessee (13.9 percent increase); Mobile, Alabama (11.2 percent increase); Madison, Wisconsin (10.8 percent increase).
Those major metros with at least 1 million people that saw annual home price appreciations occurring in the second quarter of 2019 included: Milwaukee, Wisconsin (9.0 percent increase); Boston, Massachusetts (9.0 percent increase); Salt Lake City, Utah (8.7 percent increase); Columbus, Ohio (8.1 percent increase); and Birmingham, Alabama (6.3 percent increase).
Prices in Denver, Austin, Dallas and Nashville 50+ percent above pre-recession peaks
Median home prices in 110 of the 149 metro areas analyzed in the report (74 percent) were above pre-recession peaks in the second quarter of 2019, led by Greeley, Colorado (87 percent above); Shreveport, Louisiana (81 percent above); Denver, Colorado (80 percent above); Austin, Texas (77 percent above); and Fort Collins, Colorado (76 percent above).
Including Denver and Austin, other major metros with at least 1 million people and with Q2 2019 median home prices at least 40 percent above pre-recession peaks were Dallas-Fort Worth, Texas (72 percent above); Nashville, Tennessee (71 percent above); San Antonio, Texas (58 percent above); Houston, Texas (54 percent above); and San Jose, California (54 percent above).
Average home seller gains increase quarterly and annually
U.S. homeowners who sold in the second quarter of 2019 realized an average home price gain since purchase of $67,500, up from an average gain of $57,706 in Q1 2019 and up from an average gain of $60,100 in Q2 2018. The average home seller gain of $67,500 in Q2 2019 represented an average 33.9 percent return as a percentage of original purchase price.
Among 149 metropolitan statistical areas analyzed in the report, those with the highest average home seller returns in Q2 2019 were San Jose, California (85.0 percent); San Francisco, California (71.6 percent); Seattle, Washington (65.6 percent); Salem, Oregon (62.3 percent); and Salt Lake City, Utah (60.7 percent).
Average homeownership tenure drops annually in Tucson, Portland and Phoenix
Counter to the national trend which saw the longest homeownership tenure to date, the average homeownership tenure in Q2 2019 decreased from a year ago in 28 of 108 metro areas analyzed in the report (26 percent), led by Merced, Colorado Springs, Vallejo, Springfield and Bremerton.
Among major metropolitan areas that have a population of at least 1 million and where tenure decreased in the second quarter of 2019. The longest average times sellers lived in their homes were in Tucson, Arizona (8.88 years); Portland, Oregon (9.04 years); Phoenix, Arizona (8.17 years); San Francisco, California (10.26 years); and Tampa-St. Petersburg, Florida (7.85 years).
Share of cash sales decrease annually
All-cash sales represented 25.0 percent of all single family and condo sales in Q2 2019, down from 27.7 percent of all sales in the previous quarter, and down from 26.9 percent of all sales in Q2 2018.
Among major metropolitan areas with a population of at least 1 million, those with the highest share of all-cash sales in Q2 2019 were; Miami, Florida (40.5 percent); Detroit, Michigan (36.7 percent); Birmingham, Alabama (34.9 percent); Tampa-St. Petersburg, Florida (34.2 percent); and Jacksonville, Florida (33.9 percent).
Institutional investor sales highest in Atlanta, Charlotte, and Memphis
The share of U.S. single family home and condo sales sold to institutional investors (entities buying at least 10 properties in a calendar year) was 2.2 percent in the second quarter of 2019, up from 1.9 percent in the previous quarter but down from 2.4 percent a year ago.
Among the metropolitan statistical areas with a population of at least 1,000,000 and at least 50 institutional investor sales in Q2 2019, those with the highest share of institutional investor sales in the second quarter were; Atlanta, Georgia (7.9 percent); Charlotte, North Carolina (6.7 percent); Memphis, Tennessee (6.4 percent); Birmingham, Alabama (5.6 percent); and Raleigh, North Carolina (5.5 percent).
Share of FHA buyers increase annually
Sales to FHA buyers (typically first-time homebuyers or other buyers with a low-down payment) represented 11.6 percent of all U.S. single family and condo sales in Q2 2019, up from 11.1 percent of all sales in the previous quarter and up from 9.9 percent in Q2 2018.
Among metro areas with a population of at least 1 million, those with the highest share of sales to FHA buyers were Riverside, California (18.6 percent); Indianapolis, Indiana (18.4 percent); San Antonio, Texas (18.2 percent); Providence, Rhode Island (17.8 percent); and Kansas City, Missouri (17.6 percent).
Share of distressed sales continuing downward trend
Total distressed sales — bank-owned (REO) sales, third-party foreclosure auction sales, and short sales — accounted for 11.4 percent of all single family and condo sales in Q2 2019, down from 14.0 percent in the previous quarter and up less than one percent from the same time last year.
Among 149 metropolitan statistical areas with a population of at least 200,000 and at least 100 total distressed sales in Q2 2019, those with the highest share of total distressed sales were Atlantic City, New Jersey (27.6 percent); Trenton, New Jersey (25.3 percent); Norwich-New London, Connecticut (22.2 percent); Erie, Pennsylvania (22.1 percent); and Macon, Georgia (20.7 percent).
Counter to the national trend of a slight annual uptick, 110 of the 150 metro areas (73 percent) posted year-over-year decreases in share of distressed sales. Those major metros with a population greater than 1 million that saw an annual decline were Dallas-Fort Worth, Texas (down 25.7 percent); Boston, Massachusetts (down 24 percent); Portland, Oregon (down 23.6 percent); Buffalo, New York (down 22.1 percent); and Tucson, Arizona (down 21.2 percent).
The Place for Lending Visionaries and Thought Leaders. We take you beyond the latest news and trends to help you grow your lending business.